- Home
- Resources
- Phenotypic Data
- Metabolism and Activity in the Comprehensive Cage Monitoring System
Metabolism and Activity in the Comprehensive Cage Monitoring System (CCMS)
Rationale:
The Comprehensive Cage Monitoring System (CCMS) generates data relevant to both metabolism and behavior. The mice are monitored for up to 72 hours (usually for 48 hours). The metabolic measurements include oxygen intake and carbon dioxide production. In addition, the respiratory exchange ratio, which is the ratio of carbon dioxide produced to oxygen consumed, and heat production are calculated for each mouse. These measurements are acquired during both the active (dark phase) and resting periods (light phase) of the light:dark cycle. These parameters supplement information obtained in other metabolic and cardiovascular assays. Activity is also continuously monitored, and includes an assessment of ambulatory and non-ambulatory horizontal activity, vertical activity (rearing events) and licking frequency. The activity data provides information on locomotor activity and habituation to a novel environment, and complement results obtained in other behavioral assays.
Method:
The Comprehensive Cage Monitoring System (CCMS from Columbus Instruments, Columbus, OH) allows for the long-term automated, non-invasive collection of 9 parameters in 16 individual animals simultaneously.
For this study, the experimental window lasted 72 hours, beginning and ending at the start of the dark phase of the light cycle. During that time, the following endpoints were measured:
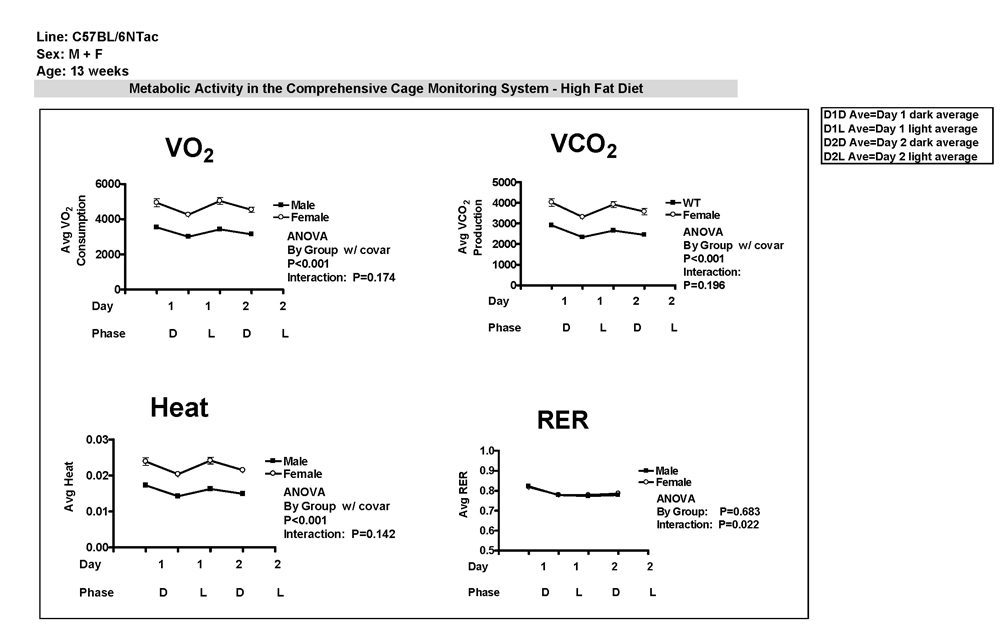
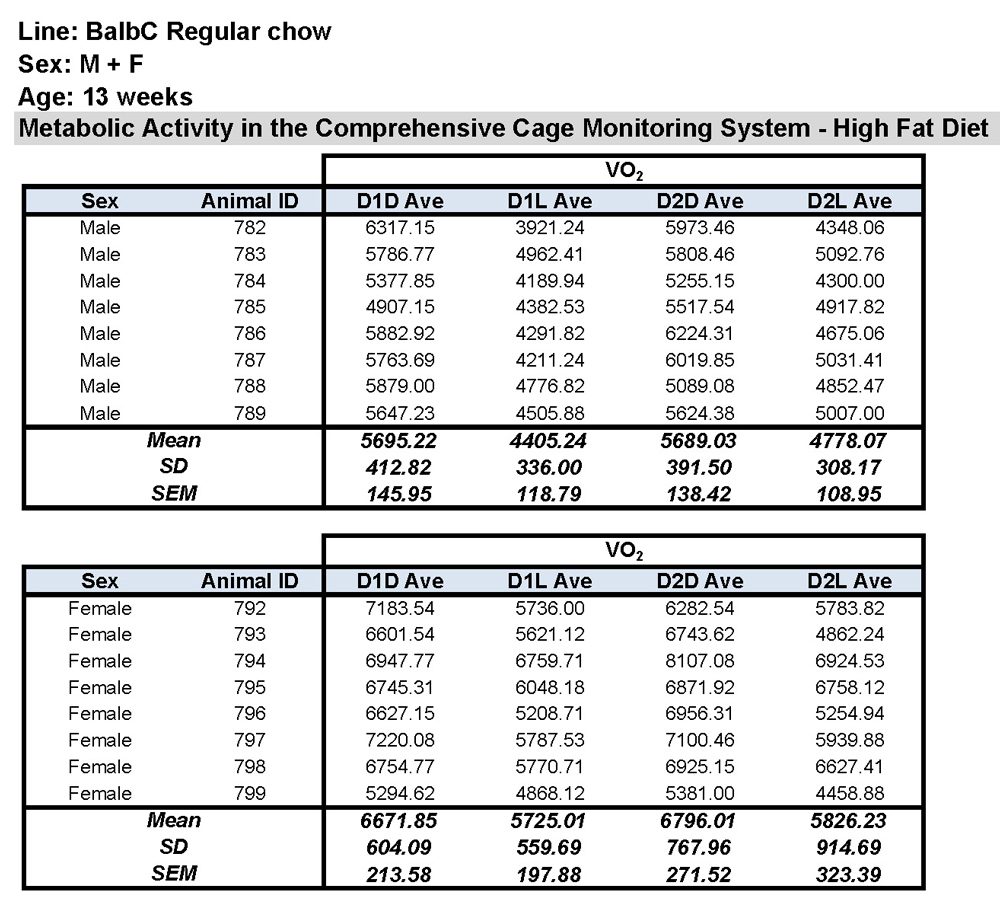
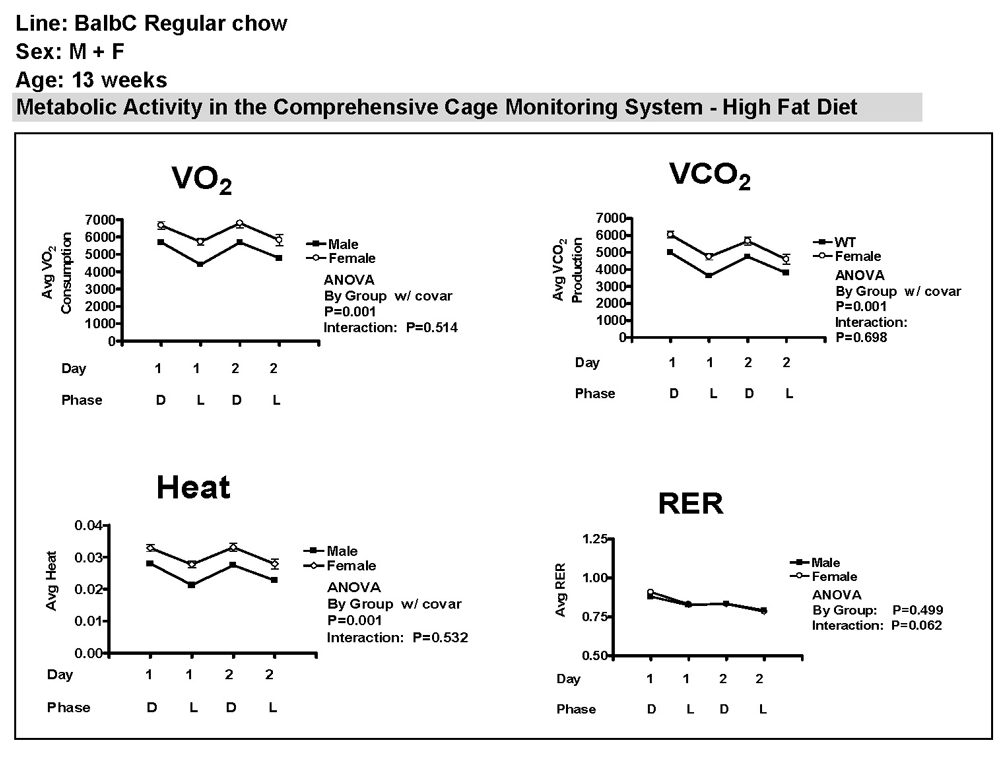
- VO2 - oxygen consumption in ml/kg/hr (calculated by the Oxymax software using the O2 differential and body weight)
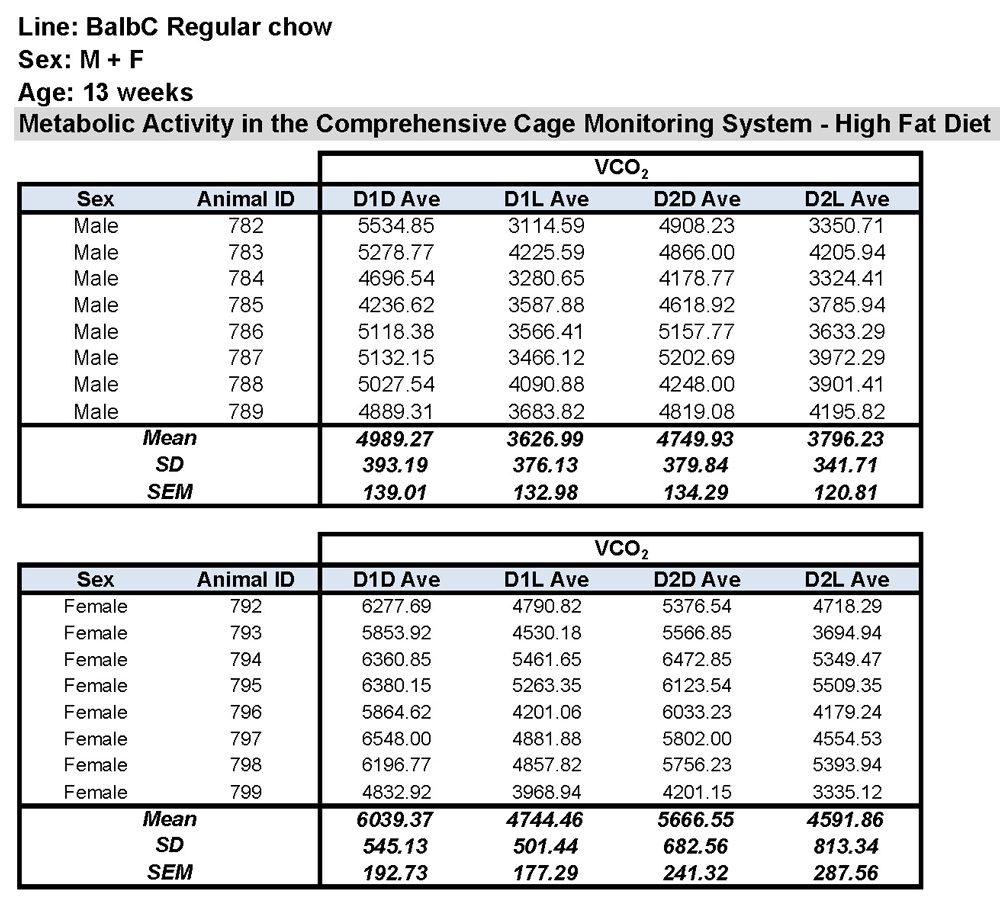
- VCO2 - carbon dioxide production in ml/kg/hr (calculated by the Oxymax software using the CO2 differential and body weight)
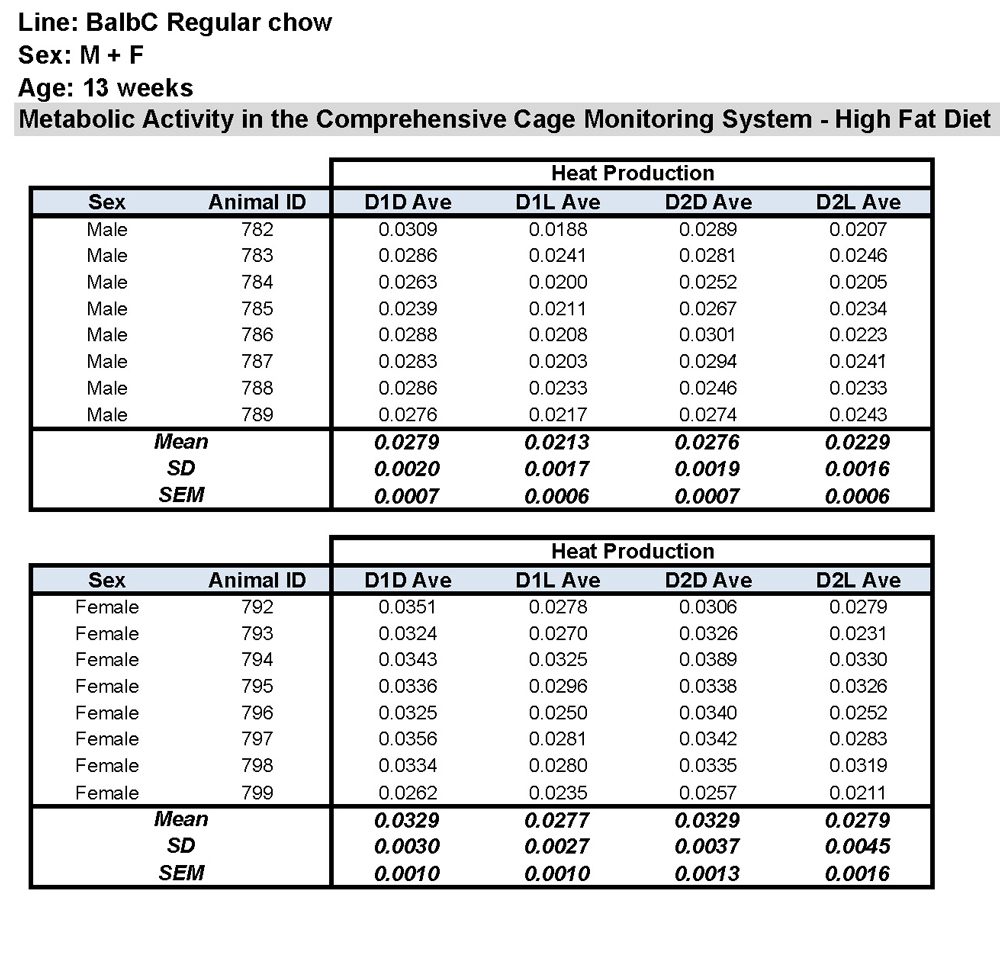
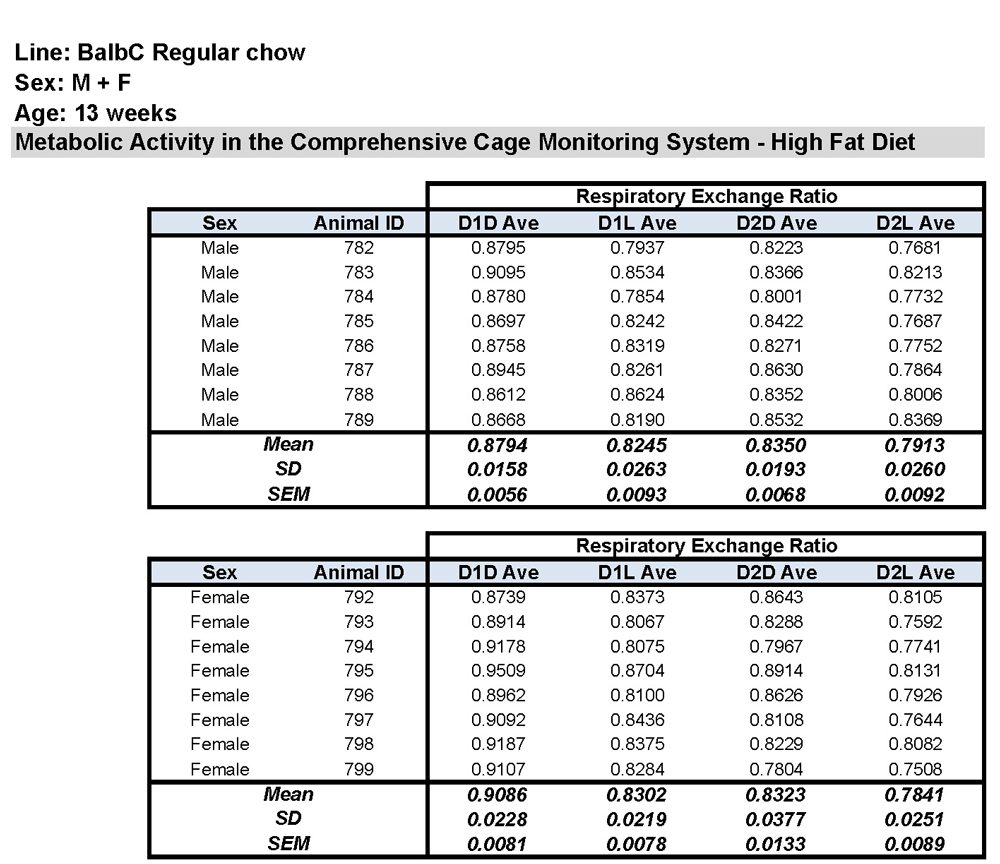
- RER - respiratory exchange ratio (VCO2/VO2) (calculated by the Oxymax software)
- Heat - kcal/kg/hr (calculated by the Oxymax software using O2 consumption, CO production and body weight)
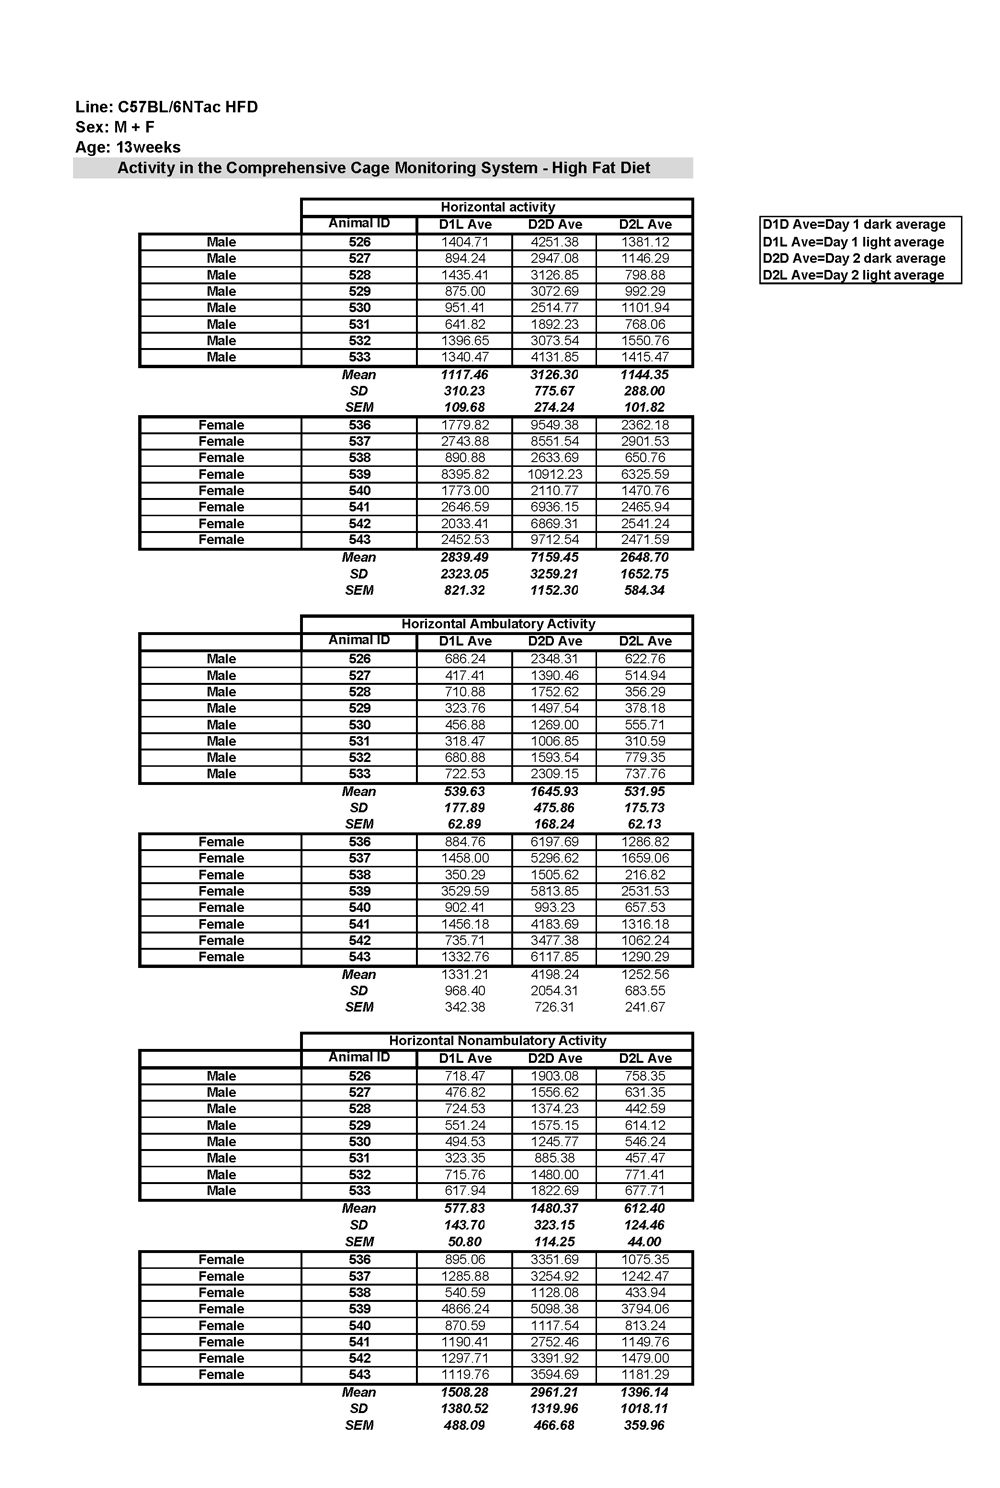
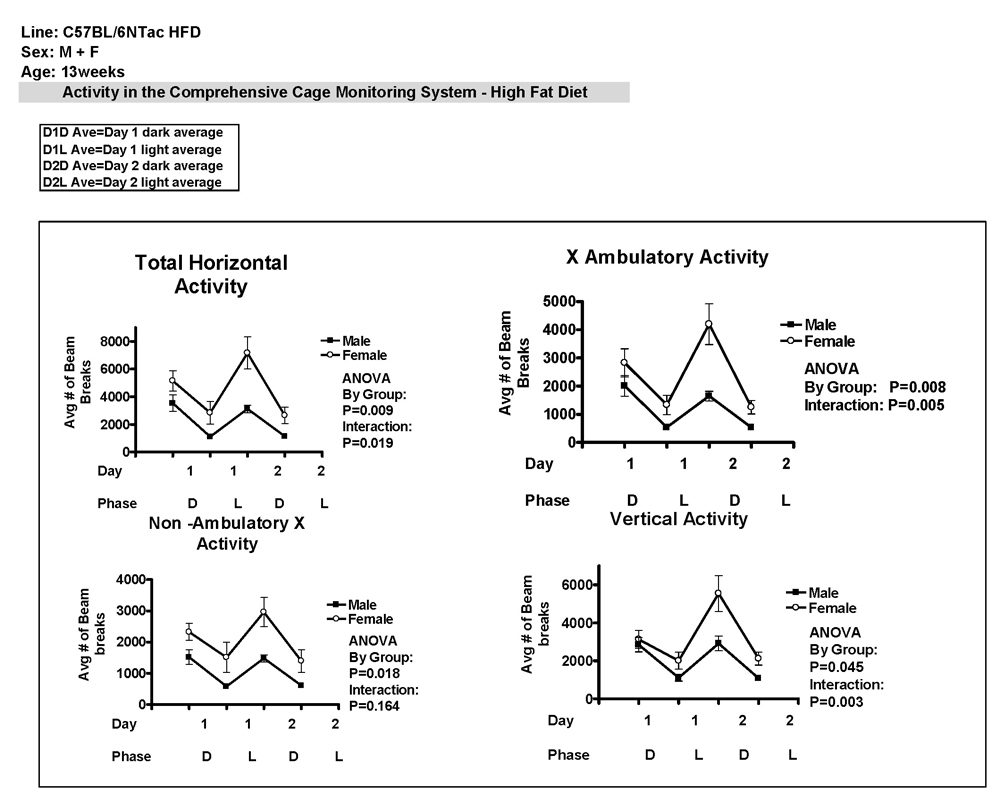
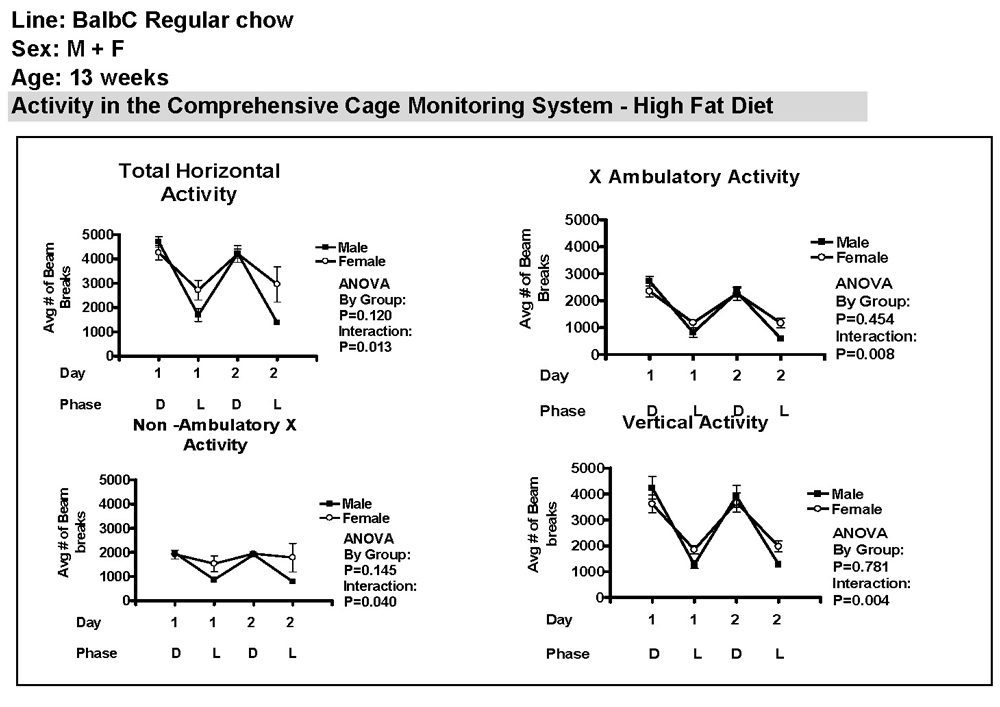
- Total X Activity - measured by infra-red (IR) beams and detectors; scored whenever a single beam was broken, which could have happened during a change in posture (turn) or during ambulation
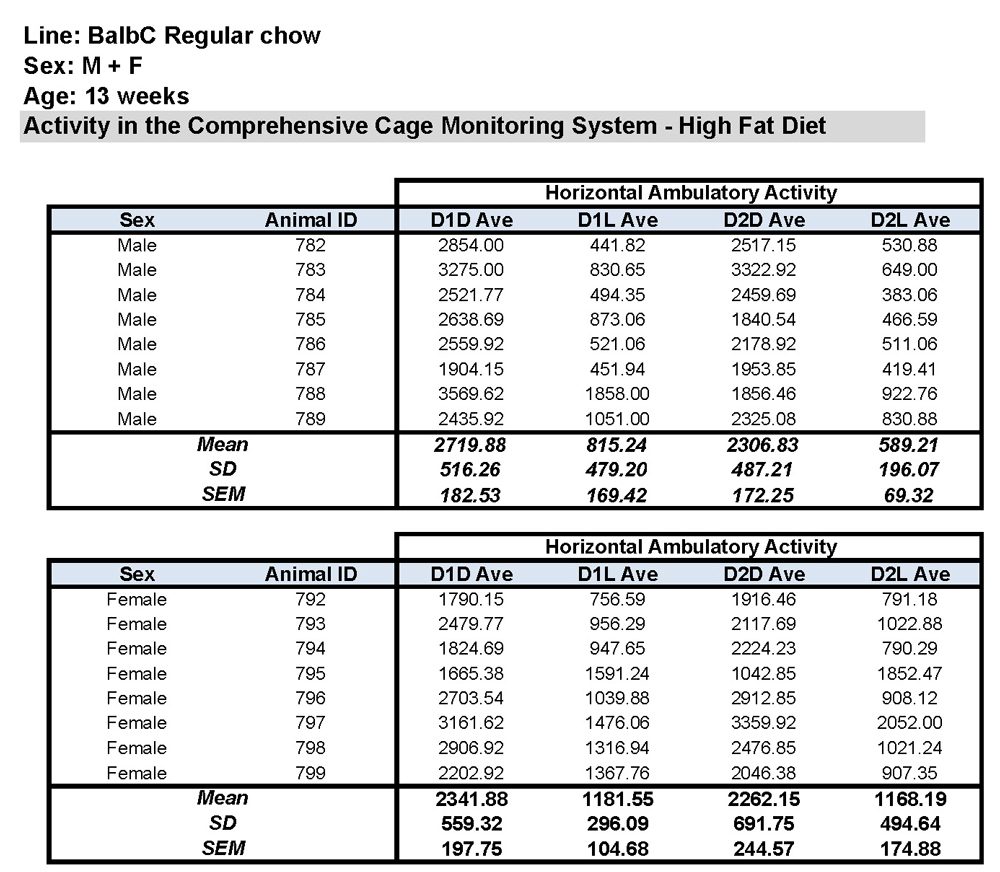
- X Ambulatory Activity - measured by IR beams and detectors; scored only when two different beams were broken sequentially, indicating movement occurred in the X plane
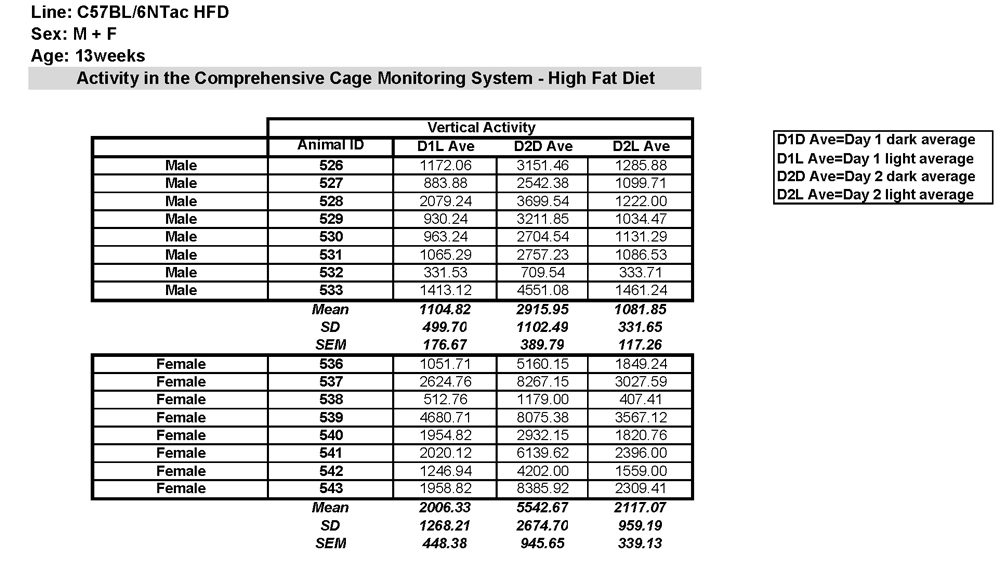
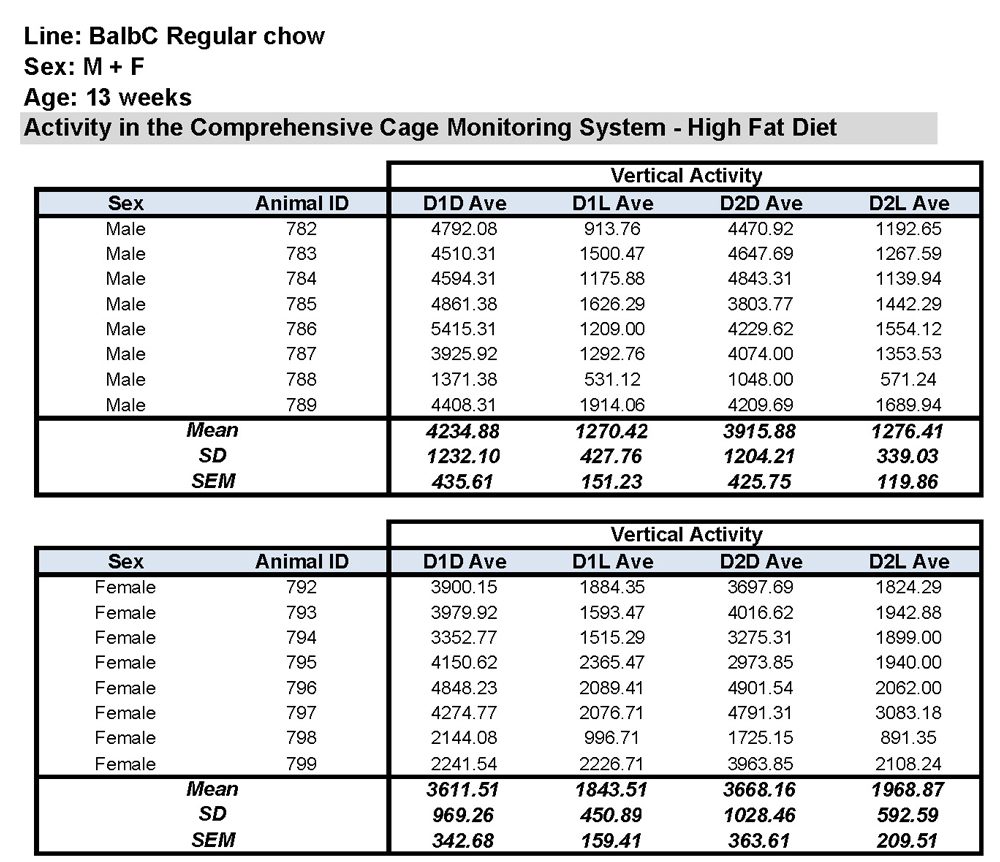
- Z (vertical) Activity - measured by IR beams and detectors placed above the X plane beams and could only have been broken when an animal reared; this parameter does not discriminate between rearing and licking from the water spout
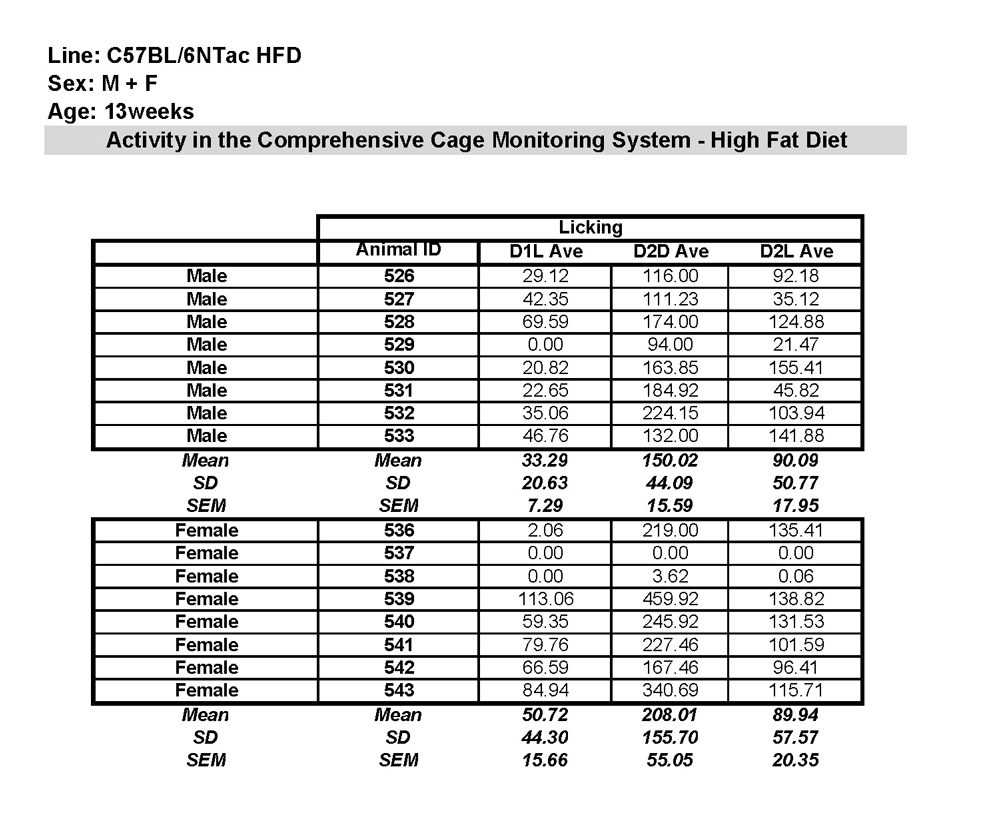
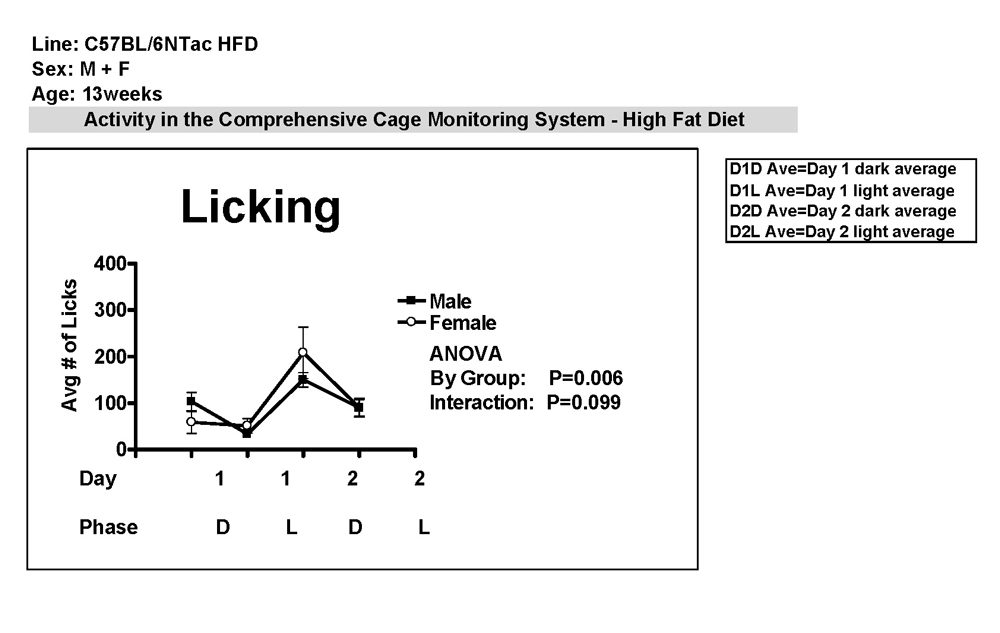
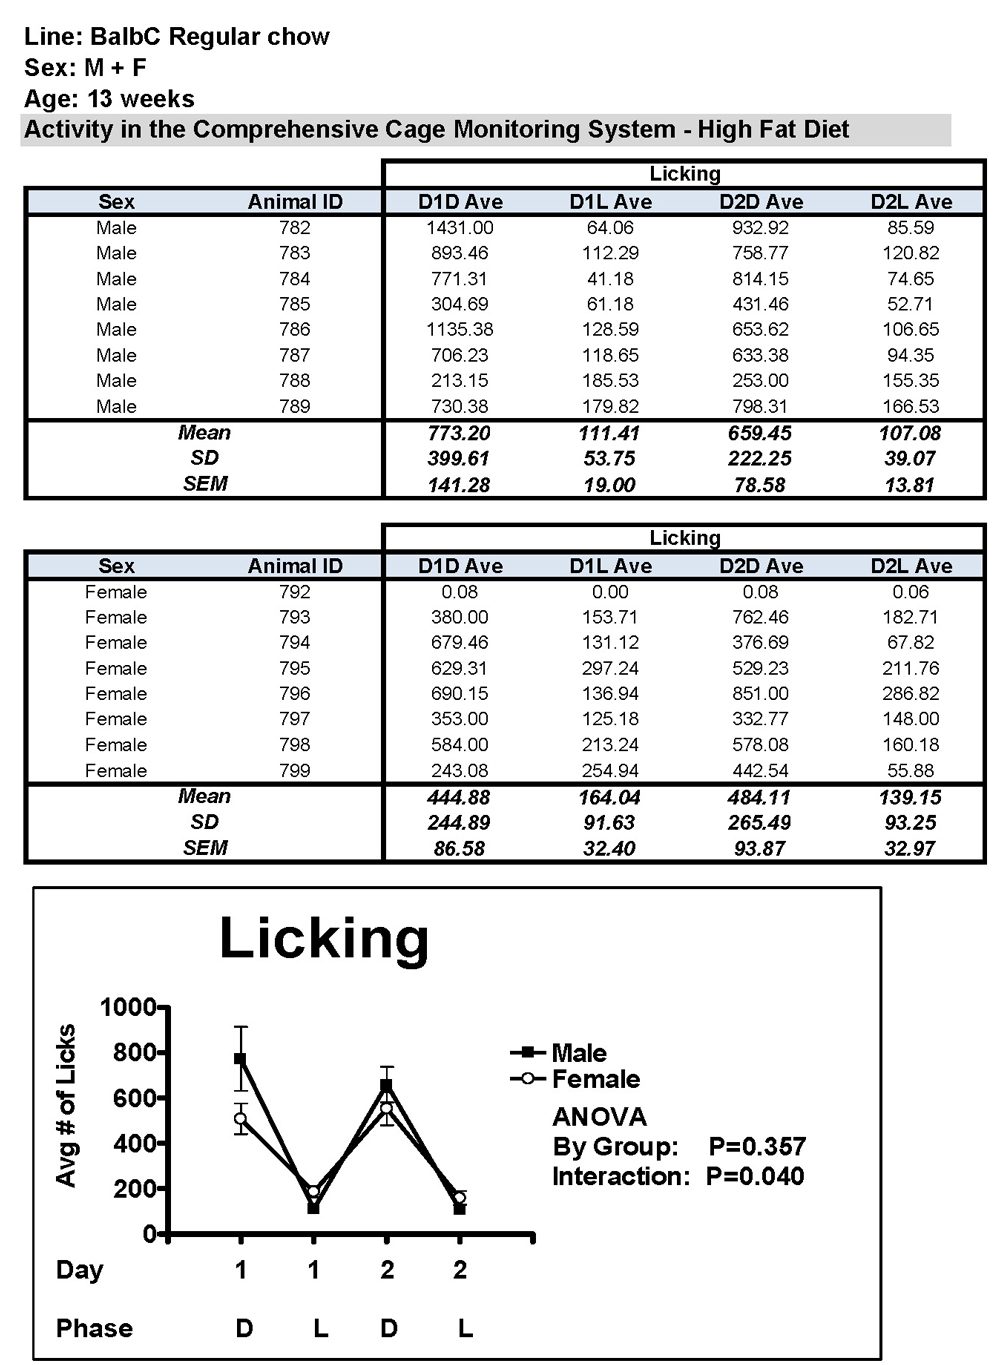
- Licking Frequency - measured electronically when a mouse touched the water dispenser
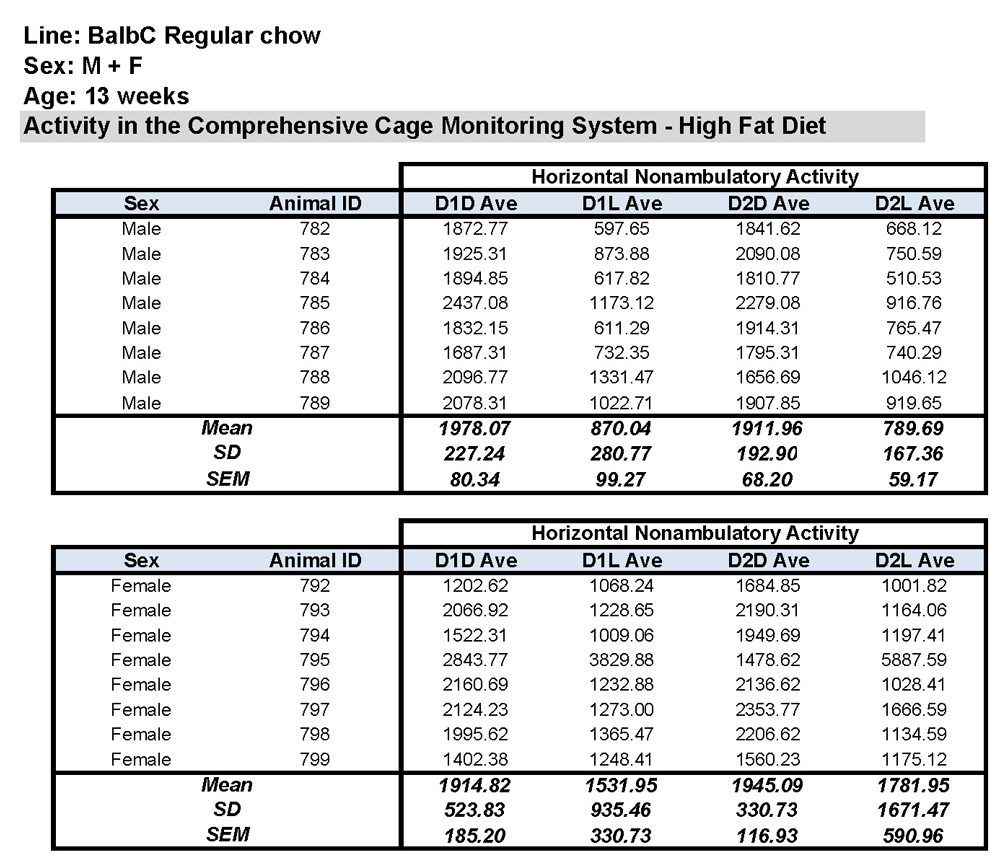
- X non-ambulatory Activity - calculated by subtracting the X ambulatory counts from the X total counts
Oxygen and carbon dioxide concentrations were measured sequentially in the 16 units. The time required for a single round of gas measurements in all of the chambers was defined as an interval. The interval lengths may have varied slightly depending on the environmental parameters of the room (temperature and humidity) and the physiological state of the experimental mice. On average, each interval was 48 minutes long. The exact time when an interval ended for each chamber is part of the output generated by the CCMS software. All of the activity endpoints described above represents the cumulative values counted by the detectors during each interval. For the purpose of statistical analysis, all of the data were averaged into individual days and photoperiods.
Data Available by Strain:
C57BL/6NTac
VO2 Data
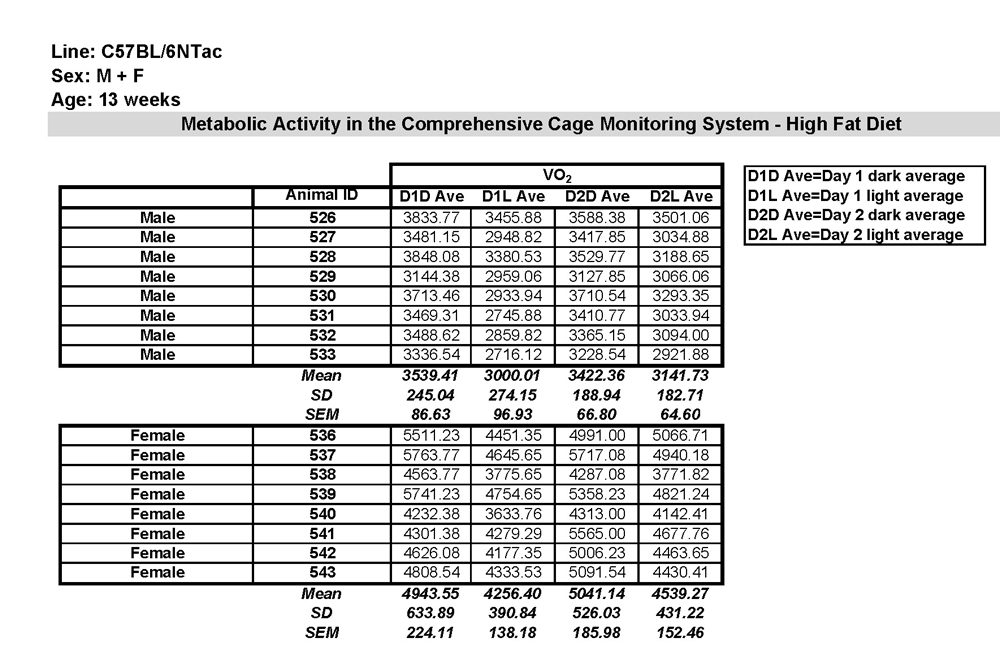

VCO2 Data
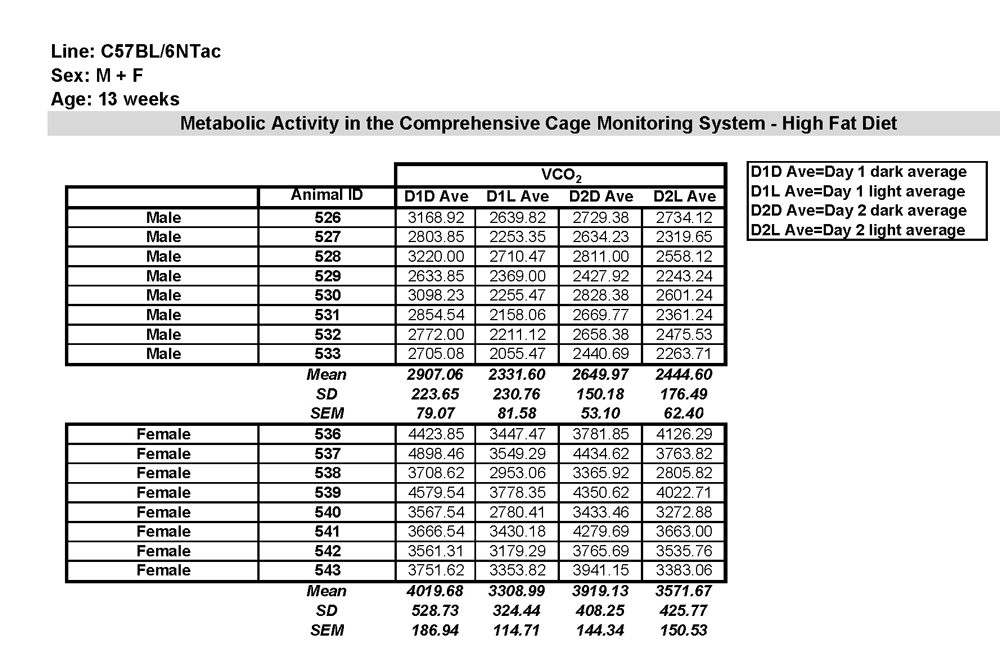

Heat Production Data
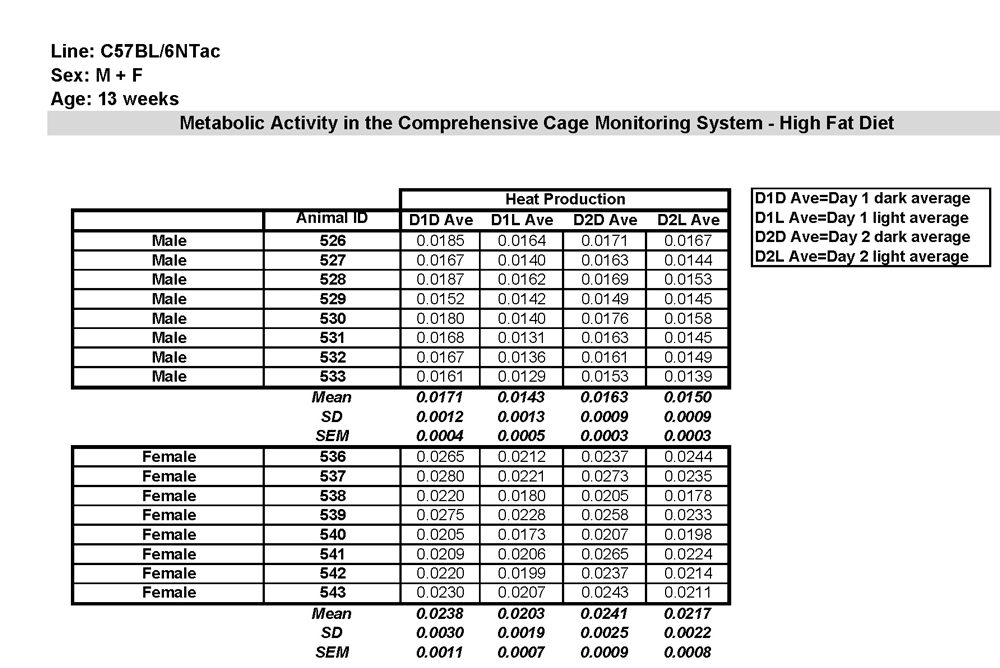

Respiratory Exchange Ratio Data
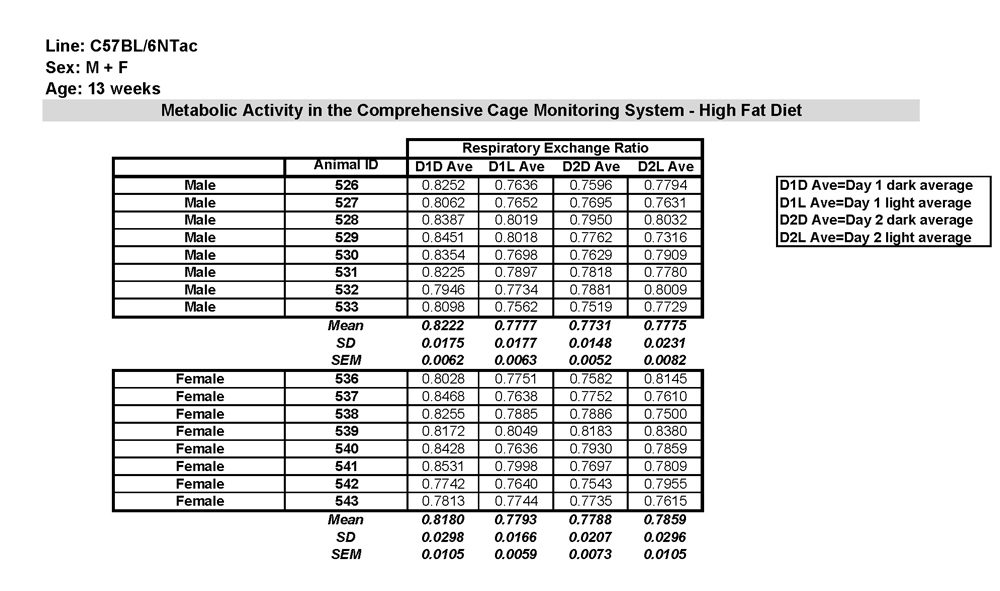

VO2, VCO2, Heat, and RER Charts

Horizontal Activity Data

Vertical Activity Data

Horizontal and Vertical Activity Chart

Licking Data

Licking Chart

BALB/cAnNTac
VO2 Data

VCO2 Data

Heat Production Data

Respiratory Exchange Ratio Data

VO2, VCO2, Heat, and RER Charts

Horizontal Ambulatory Activity Data

Horizontal Nonambulatory Activity Data

Vertical Activity Data

Horizontal and Vertical Activity Chart

Licking Data and Chart






.jpg)

.jpg)
.jpg)
.jpg)
.jpg)


.jpg)


.jpg)
.jpg)

.jpg)


.jpg)


.jpg)

.jpg)


