Understanding the phenotype associated with a targeted or gene trapped mutation is essential for identifying and selecting drug targets or studying symptoms of human diseases. Taconic enables you to jumpstart your research by offering off-the-shelf phenotypic data packages for all of the Knockout Repository lines. These phenotypic data were collected at the time that the line was generated. Cohorts of animals were developed and tested in a comprehensive battery of assays that were fully validated with benchmark knockouts and/or drugs to confirm their reliability and reproducibility.

| Base Price | ||
| Model Type | Commercial | Non-Profit |
| Basic Data Package | $3,000 / €3.000 | $3,000 / €3.000 |
| Comprehensive Data Package | $8,000 / €8.000 | $6,000 / €6.000 |
| If Breeding Your Repository Model at Taconic (50% discount on data package price) | ||
| Model Type | Commercial | Non-Profit |
| Basic Data Package | $1,500 / €1.500 | $1,500 / €1.500 |
| Comprehensive Data Package | $4,000 / €4.000 | $3,000 / €3.000 |
Phenotypic assays focused on 6 main disease areas:

Cancer

Cardiovascular Disease

Immune System Disorders
Neurological Disorders
Ophthalmology

Metabolic Disorders
Basic Phenotypic Data Packages
The Basic Phenotypic Data Package was designed to provide a snapshot of the genetic manipulation and viability of the line.
Includes:
- Functional category of the knockout gene
- Cellular location
- Mouse and human accession numbers
- Mutation description
- Overall summary
- RT-PCR expression panel (minimum of 13 tissues)
For Gene Trapped Lines:
Confirmation of loss of endogenous transcript by RT-PCR
An example of the RT-PCR analysis performed on the non-lethal gene trapped lines is shown below. Primers complementary to exons flanking the insertion site are used in an RT-PCR reaction to determine whether the gene trapping vector has effectively disrupted transcription of the endogenous message in homozygous mice.

Three samples were run for each tissue type under the following conditions:
- Tissue in the absence of gene specific reverse transcript (RT) and Actin control primers.
- Tissue in the presence of RT and the absence of Actin primers.
- Tissue in the presence of RT and Actin primers.
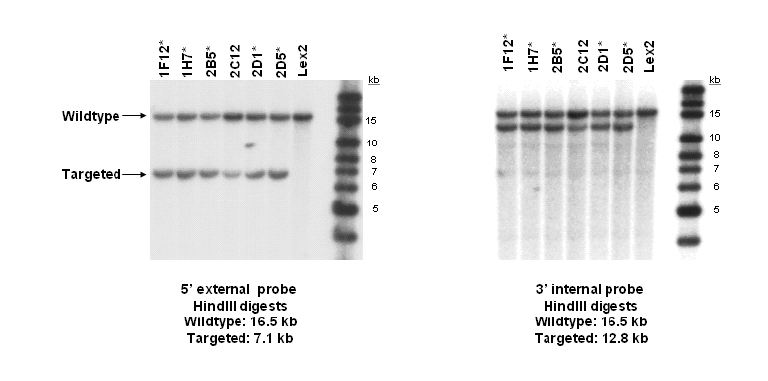
For Targeted Mutation Lines: Southern Blot confirmation of ES cells
Targeted alleles were made using homologous recombination and positive-negative selection to insert a selectable marker in place of the deleted genomic sequence. Below are examples of QC data that include a diagram of the endogenous locus, the targeting vector, and the southern probes and strategy to identify correctly targeted clones.

The viability of a KO line is an important initial question in assessing its potential utility as a research model. Basic viability measures that include fertility, expected and observed genotypes, and weight and length measures were collected on all KO Repository lines.
Fertility:
Male and female fertility measures include age (in days) of first mating, parental age, and number of offspring. One male and 2-4 female F2 homozygous mice are tested for fertility for each project. The male mouse is bred to two wild type female mice for 14 days. The female mice are bred individually with up to three different wild type male albino mice for a period of 60 days. Pregnant females (homozygous and wild type) are monitored daily for births and pup numbers are counted at birth and at post-natal day 4. Pups are monitored daily for milk spots in their stomachs and for growth. Special care is taken not to disturb the litter environment.
Data is presented in the following format:
Parental Mouse | Offspring | ||||||
|---|---|---|---|---|---|---|---|
| Mouse ID | Genotype | Sex | First Mating Age | Parental Age | # Live Pups | # Dead Pups | Total |
| 001-F | Homozygous | F | 142 | 164 | 5 | 0 | 5 |
| 002-F | Homozygous | F | 144 | 166 | 6 | 0 | 6 |
| 003-M | Homozygous | M | 66 | 88 | 8 | 0 | 8 |
Genetics:
Genetics information is reported in table form, showing the numbers of wild type, heterozygous, and homozygous animals arising from heterozygous x heterozygous crosses.
| KO Mouse Model TF0000 | ||||
|---|---|---|---|---|
| Wild Type | Heterozygous | Homozygous | Total | |
| Observed Number of Offspring | 60 | 109 | 68 | 237 |
| Expected Number of Offspring | 59.25 | 118.5 | 59.25 | 237 |
| Chi Squared = 2.06 | Significance = 0.357 | homozygote/n = 0.29 | Average Litter Size = 9 |
Body Weight:
Body weights are collected from equal numbers of male and female mice that are homozygous, heterozygous, or wild type for a specific mutation. Body weight measures are taken at 2, 4, 6, 8, 10, 12, or 14 weeks of age. Mean body weights of a specific mutant mouse line are compared to short-term (data collected within 60 days of current measures) and long-term (derived from data collected on more than 10,000 animals) historical means for wild type mice.
Displayed below is a sample graph of how body weight observations are presented. In comprehensive phenotypic data packages graphs are interactive. Raw or calculated data and statistics can be seen by clicking on points in the graph.
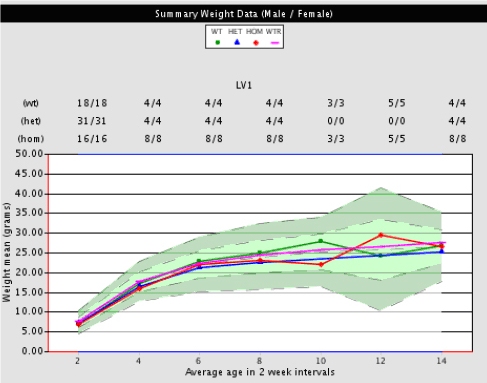
Figure illustrates mean body weights for wild type littermates (green circle), heterozygous (blue triangle), homozygous (red diamond), and recent historical wild types (purple line) plotted against long-term means for wild type animals (green shading). Mean body weights of mutant mice fall within the light green shaded area that represents long-term historical body weight means (+/- 1 standard deviation) for wild type mice. Dark green areas represent long-term historical means (+/- 2 standard deviations) and above or below green shaded areas represents long-term historical means (+/- 3 standard deviations).
Body Length
Body length measures are collected from equal numbers of 16 week old male and female mice that are homozygous, heterozygous, or wild type for a specific mutation.
Displayed below is a sample graph of how body length observations are presented. In comprehensive phenotypic data packages graphs are interactive. Raw or calculated data and statistics can be seen by clicking on points in the graph.

Figure illustrates body length measures in centimeters of male and female (left), male (center), and female (right) mutant mice. Mean body lengths for wild type littermates (green circle), heterozygous (blue triangle), homozygous (red diamond), and recent historical wild type (purple line) mice are plotted against long-term means (+/- 2 standard deviations) for wild type animals (green shading).
Comprehensive Phenotypic Data Packages
As KO Repository lines were created the effects of genetic manipulations were characterized using a comprehensive panel of tests and challenges specifically designed to identify phenotypes relevant for drug discovery research. Phenotypic data packages from initial screens are available for each line. These packages include all data in the Basic Phenotypic Package plus disease-related assays. Listed below are the assays performed by disease area. Please note that not all mouse lines have data for all assays.
Assays performed by disease area:
| Neurological Disorders | Metabolic Disorders |
|---|---|
| Open Field | Growth Rate |
| Inverted Screen | Body Fat |
| Functional Observation Battery | Bone Mineral Density |
| Hot Plate | Urinalysis |
| Pre-pulse Inhibition | Blood Chemistry |
| Tail Suspension | Retinal Exam |
| Circadian rhythm | Angiography |
| Formalin Paw | Serum Insulin |
| Stress-induced Hyperthermia | Glucose Tolerance |
| Trace Conditioning | CAT scan |
| Marble Burying Assay | HgbA1C Levels |
| Resistance to Neurodegeneration | High-fat Diet Challenge |
| Immune System Disorders | Cardiovascular Disease |
| Complete Blood Cell Count | Blood Pressure |
| FACS Analysis | Fundus Photography |
| Ovalbumin Challenge | Angiography |
| LPS Challenge | Blood Chemistry |
| Total Organism Histological Survey | Heart Rate |
| Immunohistochemistry | Inflammation |
| Soluble ICAM | |
| Bleeding Time | |
| Isoproterenol Challenge | |
| Cancer | Ophthalmology |
| Cell Proliferation | Fundus Photography |
| Angiogenesis | Angiography |
| Mammary Development | Intraocular Pressure |
| Radiation Sensitivity | Phenol Red Thread Test |
| Fertility | |
- For assays that were not sex-specific, equal numbers of males and females were tested.
- For non-lethal homozygous lines the following number of each genotype were assessed:
- 2-4 wild type
- 0-4 heterozygotes
- 4-8 homozygotes
- For histological analyses a maximum of 2 animals per group were assessed. Only remarkable findings are reported.
- For lethal homozygous lines the following number of each genotype were assessed:
- 2-4 wild type
- 4-8 heterozygotes
- For histological analyses a maximum of 2 animals per group were assessed. Only remarkable findings are reported.
Lines were created by injecting 129S5 ES cells into C57BL/6J-Tyrc-Brd blastocysts. Resulting mice were then bred with B6129F1 hybrids to maintain a mixed 129S5 x C57BL/6J-Tyrc-Brd background.
Base Price | ||
| Model Type | Commercial | Non-Profit |
| Basic Data Package | $3,000 / €3.000 | $3,000 / €3.000 |
| Comprehensive Data Package | $8,000 / €8.000 | $6,000 / €6.000 |
If Breeding Your Repository Model at Taconic(50% discount on data package price) | ||
| Model Type | Commercial | Non-Profit |
| Constitutive Model | $1,500 / €1.500 | $1,500 / €1.500 |
| Comprehensive Data Package | $4,000 / €4.000 | $3,000 / €3.000 |
Find your Knockout Repository model of interest, sign the Terms of Sale for Phenotypic Data Packages and provide a PO. It's as easy as that.